At ArcFusion, we believe in learning out loud. We share what we build, how we build it, and what we learn along the way. This post is adapted from one of our internal engineering knowledge-sharing sessions.
By Seng Nu Pan · March 2026
The hardest production bugs to catch are the ones that don't look like bugs.
Uptime is green. HTTP logs are clean. Users are getting responses. But somewhere in the tool call layer, your LLM agent swallowed an error, filled in the blanks with a plausible-sounding answer, and moved on. No exception, no stack trace. Just a quietly degraded experience that nobody noticed until a client did.
This is the failure mode that standard monitoring misses entirely. And as more enterprise workflows run through AI agents, it's becoming a costly blind spot: every agent with graceful fallback logic has the potential to silently degrade without triggering a single alert.
This post covers how we closed that gap: instrumented the tool call layer, wired up monitors, and built a simulation approach that lets us validate the entire alerting pipeline before anything reaches production.

The Problem with Graceful Degradation
We ran into this while building a retail promotion platform for enterprise clients. The system uses an AI agent to help retail chain managers plan campaigns and strategize upcoming weeks. It calls multiple backend services: a calendar API for brainstorming benefit options, a revenue optimizer, and various data retrieval endpoints.
We'd built fallback logic so the agent could degrade gracefully when a tool failed. The problem was that it degraded too gracefully. When a backend service timed out or returned invalid data, the agent substituted a reasonable-sounding answer and returned a 200. No indication anything had gone wrong.
The business consequence is straightforward: the manager makes a planning decision based on incomplete data, with no signal that the data was incomplete. At scale, across dozens of retail chains, those decisions compound.
Standard HTTP monitoring sees a 200 and moves on. To catch this class of failure, you have to instrument inside the tool dispatch layer, tracking success and error rates per tool before the fallback logic has a chance to smooth things over.
Four Alert Categories Worth Monitoring
We settled on four categories. The right set will vary by use case, but these cover the most common failure modes for any agent that calls backend services.
Cost spikes and slow latency. LLM APIs bill by token. A spike of $10 in an hour with no matching increase in user requests is a signal something went wrong: a retry loop, a runaway prompt, or a misconfigured batch job. You want to know before it becomes a $200 problem.
Agent failures. When the agent itself crashes or throws an unhandled exception, the entire request fails visibly. These are the loud failures. They're easier to catch, but still worth a dedicated monitor so the on-call team gets a signal immediately rather than waiting for a user complaint.
Silent tool call failures. This is the subtler category. The agent responds successfully at the HTTP level, but a backend service timed out or returned invalid data. The user sees an answer. The monitoring dashboard shows green. The only signal is in the tool call layer itself, which is exactly why you have to instrument there explicitly.
Database and data-layer errors. Missing tables, failed queries, and malformed data can propagate through the agent in the same way tool failures do. Monitoring this layer separately lets you distinguish between an LLM problem and a data layer problem, which makes debugging significantly faster.
Why Datadog Rather than a Separate Stack
Tools like LangFuse and LangSmith handle LLM tracing well: prompt chains, token counts, model latency, tool call sequences. They work in production too, and if LLM tracing is all you need, they're a solid choice.
The gap is application-level observability. Silent tool call failures aren't an LLM problem, they're an infrastructure problem. Catching them means tracking error rates, triggering threshold alerts, and routing notifications into the same workflow your ops team already uses for everything else. LLM tracing tools aren't built for that layer.
Datadog covers LLM tracing alongside its core application monitoring. That combination is what made it the right fit here: one platform covering both the application layer (where tool call failures actually surface) and the LLM layer (token cost, model latency, request metadata), with alert routing and on-call integrations the ops team was already using.
The Alert Pipeline
The full pipeline runs two paths in parallel: a production path where real tool failures propagate into metrics, and a simulation path where we inject controlled failures for end-to-end testing. Both paths converge at the metric emitter, which means both validate the same pipeline.
Wiring Datadog to Slack
The setup has three steps.
First, install the Slack integration in Datadog: navigate to Integrations, authorize the workspace. This creates a service account Datadog uses to post to channels.
Second, create a dedicated alert channel. We used #test-alerts rather than routing into an existing dev channel, both to avoid alert fatigue and to keep a clean space for validation.
Third, configure the monitors. That's where the actual detection logic lives.
Configuring a Tool Call Failure Monitor
The example below is for calendar agent tool monitoring:
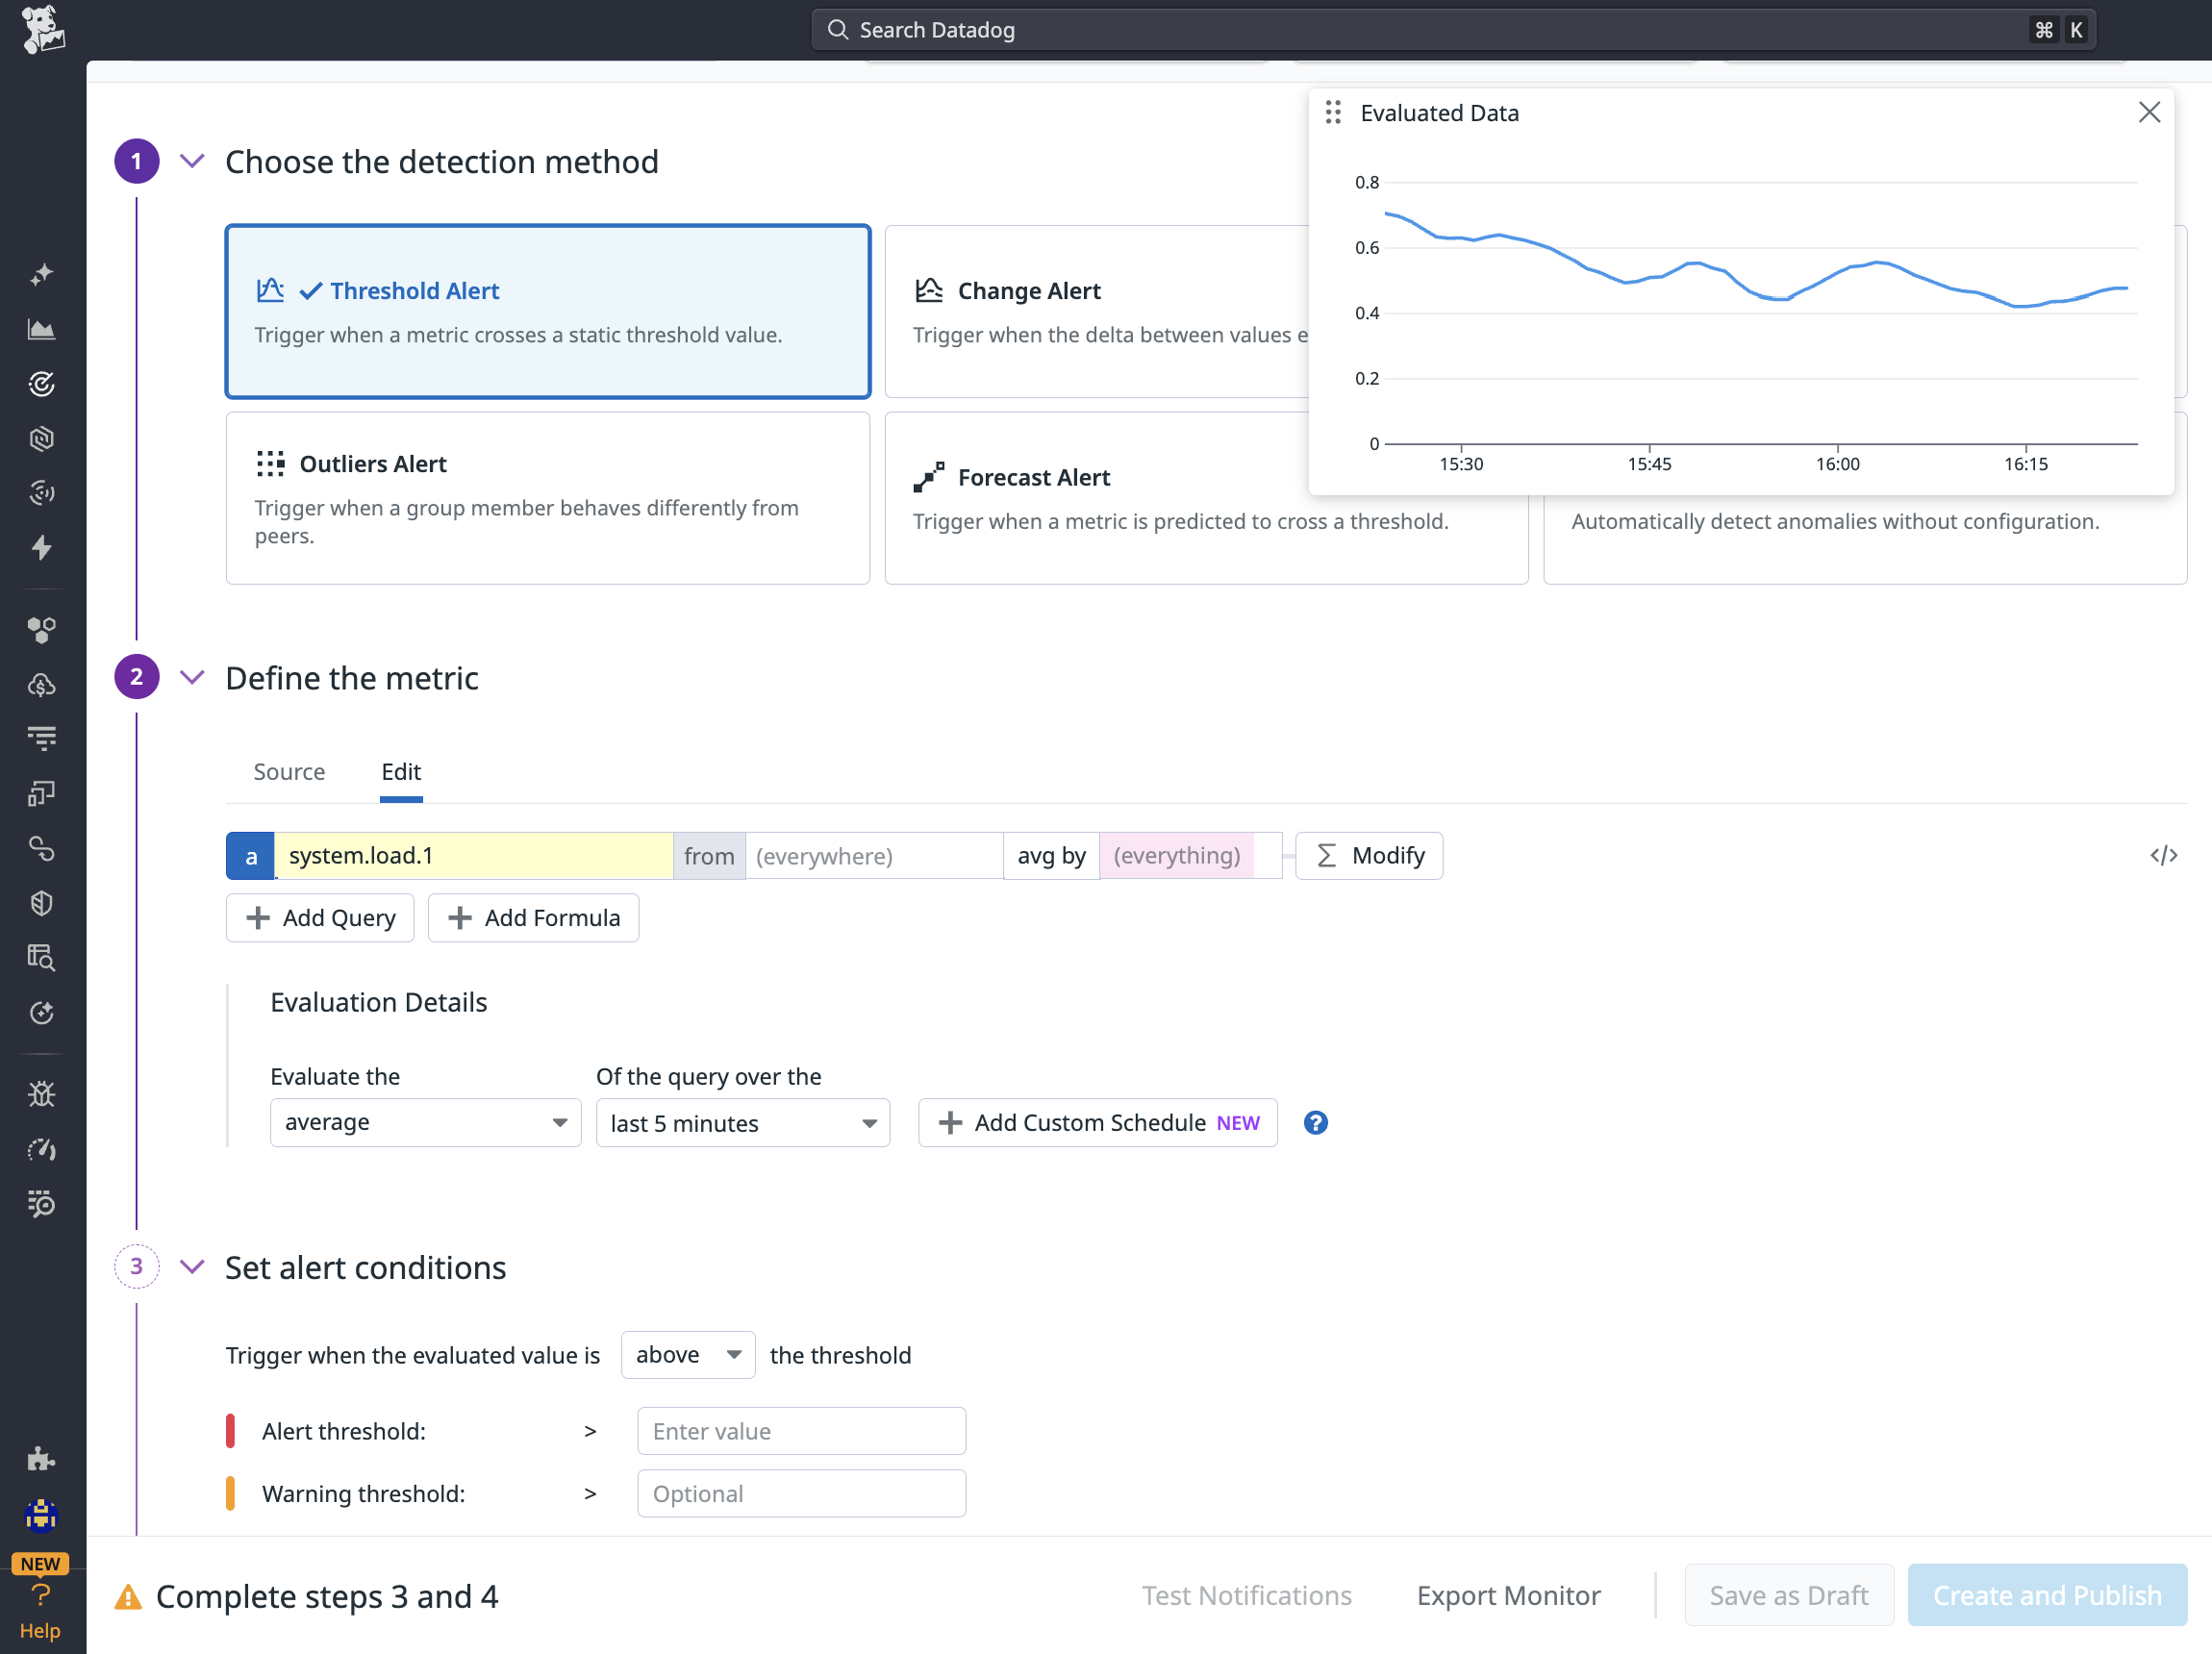
Figure 1: Configuring a threshold alert monitor in Datadog
A threshold alert fires when a metric crosses a static value — the right choice for catching any error count above zero. Grouping by environment and tool type means one monitor definition covers the entire deployment topology.
The grouped by clause matters. A single monitor definition covers development, staging, and production. Datadog evaluates the threshold per group, so if staging has a tool error and production does not, only the staging alert fires. No need to maintain separate monitors per environment per tool.
Alert message example on Slack:
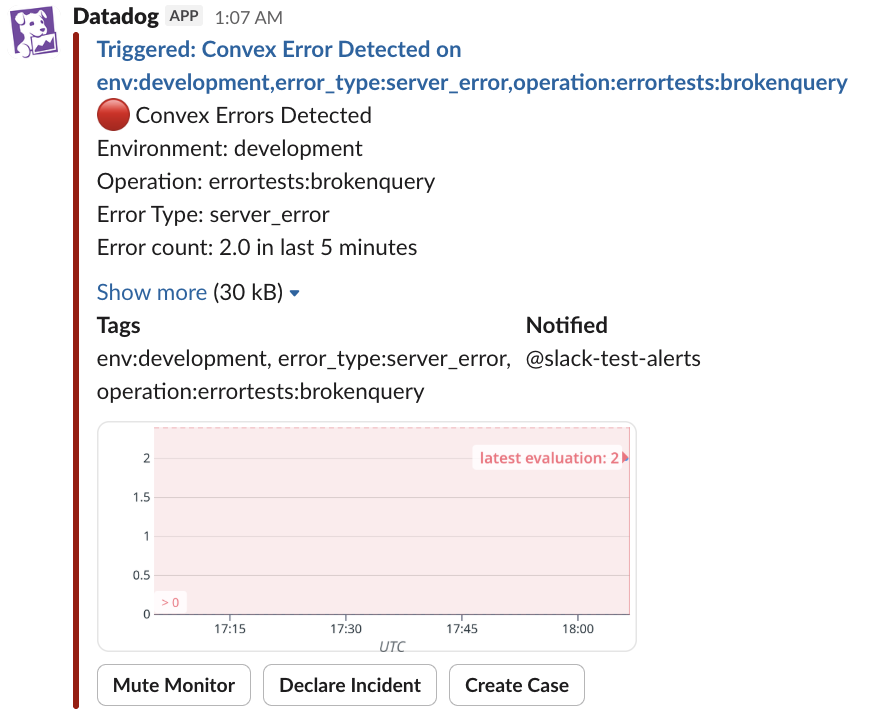
Figure 2: Slack alert fired by Datadog
When a tool call error threshold is crossed, Datadog posts directly to Slack with environment, operation, error type, and a timeseries showing when errors started — enough context to triage without opening a dashboard.
Simulating Failures Without Touching Production
You can't trust an alerting pipeline you've never triggered. We implemented an error simulation flag in the backend so we could test the full end-to-end flow in a controlled way. Sending a message with a specific simulation keyword forces the named tool to return an error. The monitoring pipeline kicks in, and the alert appears in Slack within about a minute.
If it doesn't arrive, the pipeline has a gap. That's exactly the point.
The key detail: the failure must be injected at the infrastructure layer, not the prompt layer. Prompt-layer simulation lets the agent "know" it's being tested and bypasses the real error path. Infrastructure-layer simulation exercises the actual failure handling, which is what the test needs to validate.
The Takeaway
Any AI agent with fallback logic has the potential to degrade silently. The more robust the fallback, the harder it is to detect. That's a feature that becomes a liability if observability isn't built in from the start.
Three things matter most. Instrument at the tool call layer, not just the API layer, because fallback logic will hide failures from standard HTTP monitoring. Group monitors by environment and tool type so one monitor definition covers your entire deployment topology. And build failure simulation in from day one using infrastructure-layer injection, so you can validate the full alerting pipeline before it has to work under real conditions.
An agent that fails quietly in production is, from the client's perspective, an agent that works unreliably. The observability gap is closable. It just has to be a deliberate choice.
We're building AI systems for enterprise clients across Southeast Asia, the kind of work where "it usually works" is not good enough. If you're an engineer who cares about making LLM agents production-ready, check out our open roles.